
BPA Sorption onto PE Particles
Submitted by Nicholas Hoffman on

Plastic particles exist in large quantities in the oceans. Chemical contaminants can adsorb, or 'stick' onto these particles. In this way, harmful chemicals can enter the food chain because plastic particles can be mistaken for food by aquatic life. Bisphenol-A (BPA) is one such chemical contaminant and has been recognized as an endocrine system disruptor. Endocrine system diruptors are any chemicals that interfeir with the bodies hormone producing organs. BPA is used in certain plastics and resins in a high variety of products and is therefore a widespread contaminant. Furthermore, BPA has been shown to have damaging effects at a concentration of just a few parts per million, and it has been suggested that it is of concern even on the parts per billion scale. Polyethylene (PE) is an extremely common plastic that can often be found in the ocean as microparticles. PE is broken down into these particles primarily by UV light from the sun. These particles have been shown to be ingestible by sea life and often stay or build up in the body.
In this experiment, polyethylene particles were extracted from a commercial hand soap product where the particles are used as an abrasive. This was accomplished by adding water to the soap and filtering with a vacuum. A 1 liter stock solution was made with deionized water and BPA at 50 ppm. Standards of 0, 0.5, 1, 2, 4, 6, 8, and 10 ppm were made by diluting this stock and used to create a calibration curve for high-performance liquid chromatography (HPLC) analysis. This involves sending the solutions containing the chemicals in question through a fliter-like 'column' and seeing how long it takes for the chemical to get through.
0.05 grams polyethylene particles were added to solutions of 10 ppm BPA at pH 2, 6, and 10. These solutions were shaken along with controls of matching concentration and pH. Samples were taken for each solution and control at 0, 6, 12, 24, 36, 48, 60, 72, and 84 hours, and run through the HPLC along with blanks. IR spectroscopy was used to verify the quality of the extracted polyethylene, as well as a secondary verification of the sorption of BPA onto the PE
The calibration curve mentioned above obtained from the stock solution diluted standards is pictured here:
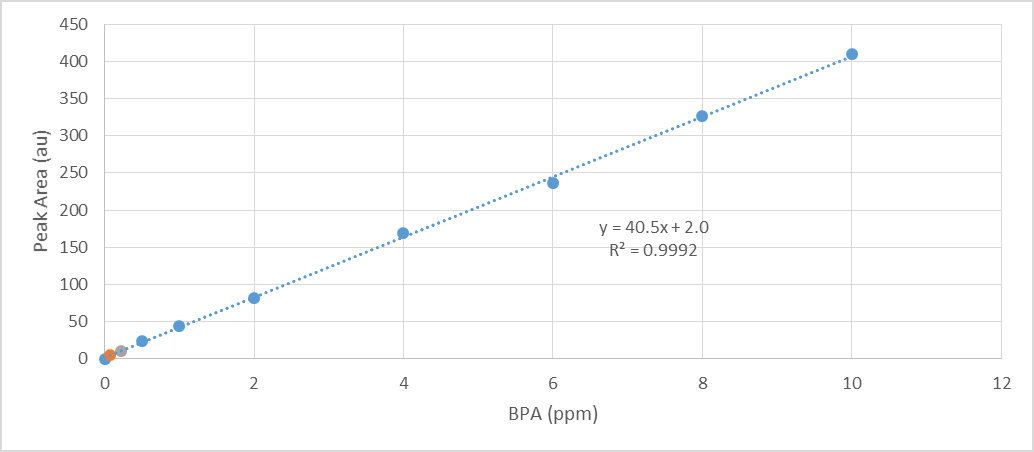
This curve calibrates, or gives us a baseline of behavior for this particular chemical, BPA; and allows of to quantify our results. The R squared value of the trendline equation is 0.9992, the limit of detection occurs at 0.07289 ppm, and the limit of quantification occurs at 0.22088 ppm. This indicates a fairly sensitive test to both detect and be able to quantify the amount of BPA in the following samples.
From the HPLC analysis, equilibrium time was plotted vs percent absorbance of BPA. The following graph maps out the percent concentration of BPA left in the solution versus time of PE particles spent stirring in solution.
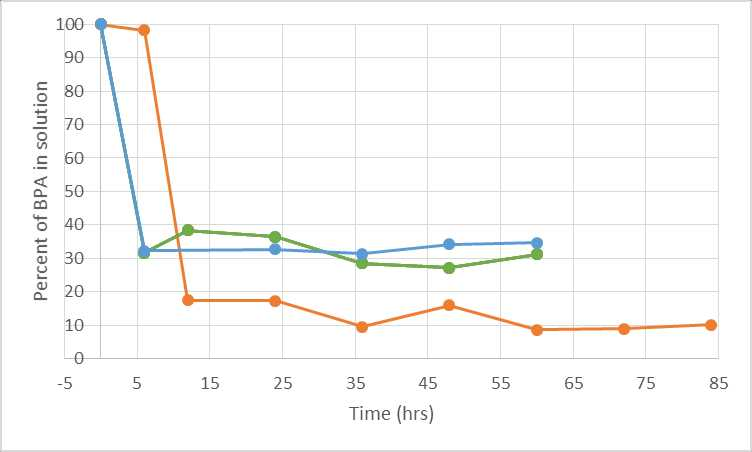
pH 6 corresponds to the orange line, pH 2 corresponds to the green line, and pH 10 corresponds to the blue line. Points of interest are highlighted in the following table
Chart Summary | |||
pH
| 2.00 | 6.00 | 10.00 |
Equilibrium time (hrs) | 36 | 60 | <6 |
Maximum adsorbed concentration (ppm) |
8.10 |
7.63 |
6.92 |
Maximum Adsorption % | 72.8 | 91.4 | 68.6 |
For pH 10, the exact equilibrium time was not discovered because of a lack of time to repeat the experiment, but it can be seen that the point must be reached somewhere between 0 and 6 hours, making it the fastest to reach equilibrium. However, the summary table shows that the longer the solutions took to reach equilibrium, the higher the maximum adsorption was, since pH 6 had by far the highest adsorption at 91.4%
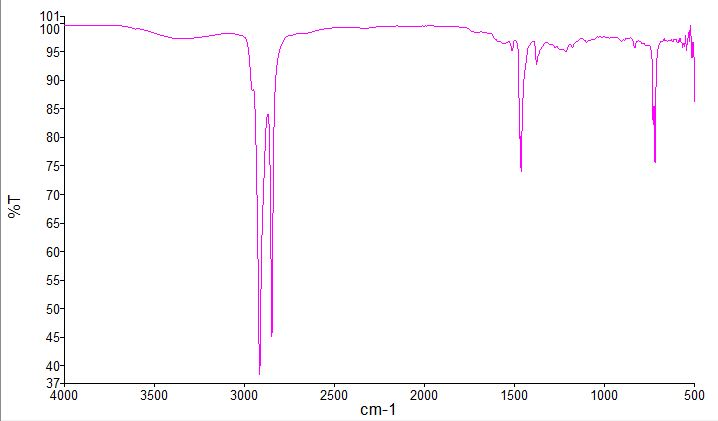
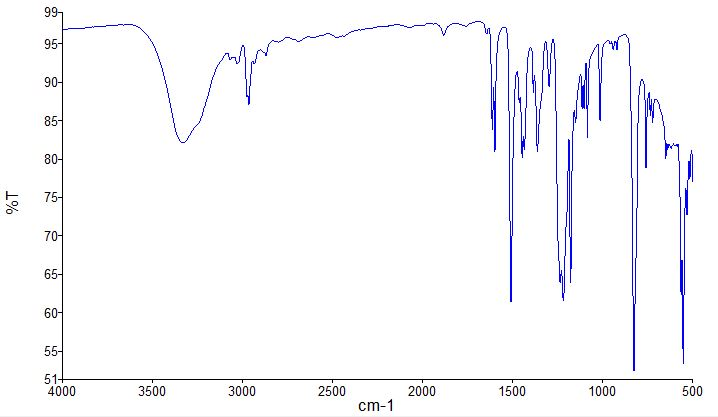
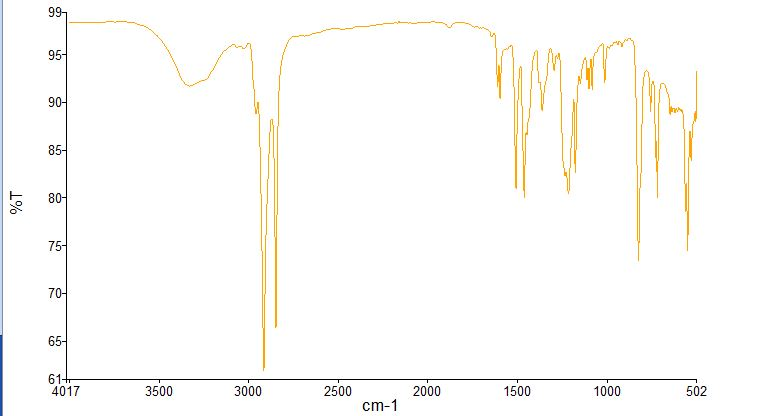
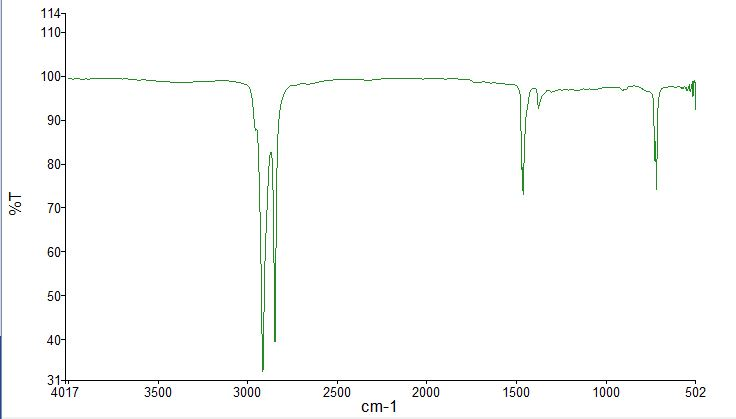
IR spectroscopy:
Four spectra were taken, and are pictured below. PE by itself was run to verify the purity of the soap samples extracted. BPA was run by itself for later identification. BPA powder along with PE particles were mixed and run together to create a hypothetical picture of what would be an expected spectra should BPA sorb onto PE particles from an aqueous solution. And finally the spectra of dried PE particles that had been in solution with BPA was taken.
PE Alone:
BPA Alone:
BPA + PE Mixed Powders:
BPA Adsorbed onto PE:
The PE spectra matches well with the literature. The combined spectra of BPA and PE appears to blend both individual spectra well, however the dried PE in solution with BPA looks completely like PE alone.
The IR spectrometer appears to have missed the BPA adsorbed onto the PE particles. This has some interesting implications. IR spectroscopy is a commonly used tool to verify if chemical contaminants are present in a sample. If IR cannot detect BPA in small numbers of ppm, an alternative should be looked for. More trials should be run to verify this, and try to determine the limit at which IR can detect adsorbed BPA. The HPLC analysis shows that PE holds promise as a potential adsorbent for BPA. However, more trials should be done to verify the results here. pH seems to play a role in the adsorption capabilities of PE, so more trials should be conducted at differing pH to find the ideal pH for maximum adsorption. Salts and other naturally found minerals should also be added to see if there is any interaction between them and the adsorption of BPA onto the plastic. As well as additional sorption study trials, 'de-sorption' should also be analyzed. This would simply entail taking dried PE particles that BPA was adsorbed onto, and adding them to a clean solution to test if and when BPA would start leaching back into the solution. Finally, the action mechanism of bonding between BPA and PE should be analyzed more in depth.
This REU was made possible by NSF DMR Grant #1460704. Great thanks belongs to Dr. Felix R. Román for advising this project, and making his labs available for this learning experience. Much thanks goes Dr. Ubaldo M. Córdova and Dr. Patricia Ortiz for organizing and running this REU. Last but certainly not least, thanks goes to Jorge Marcano for walking along side me through this REU experience and patiently sharing his knowledge and insights into the subject matter, and into lab work as a whole.